We developed and made available three types of datasets: population grids, racial grids, and racial diversity classification grids. Our data are available for each county and for 363 metropolitan areas for 1990, 2000, and 2010 as multi-year comparable datasets (called “myc”). For 2010 we also made available additional datasets that used more detailed ancillary information but cannot be used for change analysis.
GENERAL DATA INFORMATION
- Spatial resolution: 30 m
- Projection: Albers Conical Equal Area (EPSG: 5070)
- Data units for population/race grids: Estimated persons per grid cell
- Data units for racial diversity grids: one of 40 classes of racial diversity classification
- No data value for population/race grids: -9999
- No data value for racial diversity grids: 255
- Data format: Geotiff
- Date of production: January 2016
WHAT IS IN THE ZIP ARCHIVE?
ARCHIVE NAME
The name of each zip archive contains 2-letters, state code, and county name. For example, oh_hamilton.zip indicates Hamilton county in the state of Ohio.
ARCHIVE CONTENT
Each archive contains three directories:
(1) population - contains population grids for each year (4 grids)
(2) diversity - contains racial diversity classification grids for each year (4 grids)
(3) race - contains separate grids for seven race/ethnicity groups for each year (27 grids)
Notice: non-Hispanic Native Hawaiian and Other Pacific Islander (nhpi) grid are not available for the 1990 year because non-Hispanic Pacific Islander (nhpi) are included in Asian group in the U.S Census 1990.
GRIDS FILENAMES
Example: oh_hamilton_pop1990myc.tif
Filenames consist of several elements: 2-letters state code (oh), county name (hamilton), name of map (pop1990myc), file extension (.tif) . The information about available datasets and its name is here.
Zip archives contain a set of available demographic grids for each county. Zip archives contain all grids regardless of county boundary changes if the county name was the same for all years. For counties that were added/deleted in a particular year, archives contain only data for years for which a county existed under this name
Archives that include only part of data are:
- co_broomfield (only 2010)
- fl_dade (only 1990); data for 2000 and 2010 are in fl_miamidade.
- fl_miamidade (only 2000, 2010); data for 1990 are in fl_dade
- mt_yellowstonenationalpark (only 1990)
- va_cliftonforgecity (only 1990 and 2000)
- va_southbostoncity (only 1990)
For substantial changes to counties and county-equivalent entities, see the U.S Census Bureau website (www.census.gov/geo/reference/county-changes.html)
DESCRIPTION OF DATASETS
DATA AND METHODS
Demographic grids have been calculated from census blocks using the dasymetric modeling technique.
DASYMETRIC MODELING
Dasymetric modeling disaggregates aggregated population data (provided by US Census) into grid cells using ancillary data that correlates with population density but has a higher resolution.
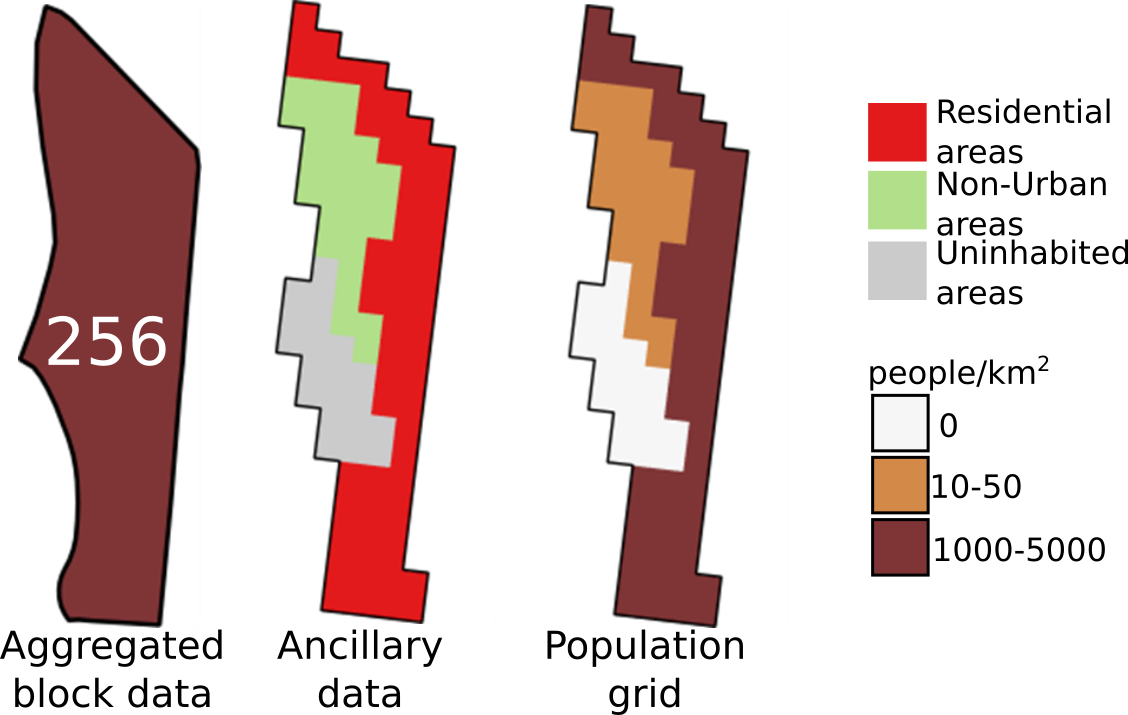
Fig. 1. How dasymetric modeling works?
High resolution grids provided by the SocScape project are the results of disaggregating US census block level data using the National Land Cover Dataset (NLCD).
For multiyear comparison datasets, we used National Land Cover Datasets 2001 and 2011 reclassified into three classes (urban, vegetation, uninhabited) and NLCD 1992/2001 Retrofit Land Cover Change Product reclassified into three classes (urban, vegetation, uninhabited).
For 2010 grids ancillary data includes National Land Cover Datasets 2011 (NLCD 2011) (reclassified into six classes) and National Land Use Dataset 2010 (NLUD2010, Theobald 2014).
POPULATION AND RACE/ETHNICITY GRIDS
Population grids are a product of dasymetric modeling. We also used a population-based dasymetric model to disaggregate race/ethnicity groups. Seven race/ethnicity hi-res grids are available: non-Hispanic white (nhw), non-Hispanic black (nhb), non-Hispanic Asian (nhas), non-Hispanic American Indian (nham), non-Hispanic Native Hawaiian and Other Pacific Islander (nhpi), non-Hispanic other race (nhother), Hispanic (hispanic).
RACIAL DIVERSITY CLASSIFICATION GRIDS
Racial diversity map shows the spatial character of racial diversity across the U.S. We use our population/race hi-res grids to prepare a three-dimensional classification of grid cells based on:
(1) racial diversity: determined based on standardized informational entropy (E):
(a) low diversity class (E<0.37 and dominant race more than 80%); (b) high diversity class (E >0.73 and a dominant race less than 50% population); (c) medium diversity otherwise.
(2) dominant race: non-Hispanic white, non-Hispanic black, non-Hispanic Asian, non-Hispanic Native American and Hawaiian, non-Hispanic other race, Hispanic.
(3) population density: (a) low density (less than 3 people/km2), (b) medium density (3-30 people/km2), (c) high density (equal or greater than 30 people/km2).
The result is a diversity–race–density classification of population cells into 40 categories (39 diversity–race–density and uninhabited class). (Fig. 2.).
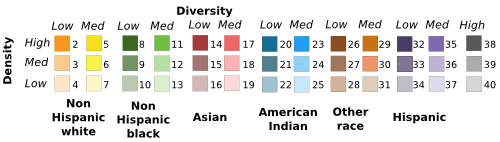
Fig. 2. Three-dimensional classification of racial diversity.
MORE INFORMATION
- A. Dmowska, T. F. Stepinski, P. Netzel (2017) Comprehensive framework for visualizing and analyzing spatio-temporal dynamics of racial diversity in the entire United States, PLoS ONE 12 (3): e0174993. paper (open access)
- A. Dmowska and T. F. Stepinski (2017) A high resolution population grid for the conterminous United States: The 2010 edition. Computers, Environment and Urban Systems 61, pp. 13-23. paper, preprint
- A.Dmowska and T.F. Stepinski, (2017) Mapping Changes of Racial Composition in the United States: 1990–2010. Annual Meeting of Population Association of America, Chicago, IL, April 26-29 2017 paper